Basic Analysis - Proteus

Today we are going to be diving in to some basic static and dynamic analysis on a live sample of malware. This is my first time doing something like this so I am super excited! The malware strain I chose to analyze is known as Proteus. Proteus was a botnet discovered back in 2016 that offered capabilities such as crypto mining, keylogging and credential theft. The goal of today’s analysis is to extract some basic indicators of compromise (IOC) that could be used to profile this malware strain. In another post I plan to perform a deeper analysis to figure out the overall functionality of Proteus.
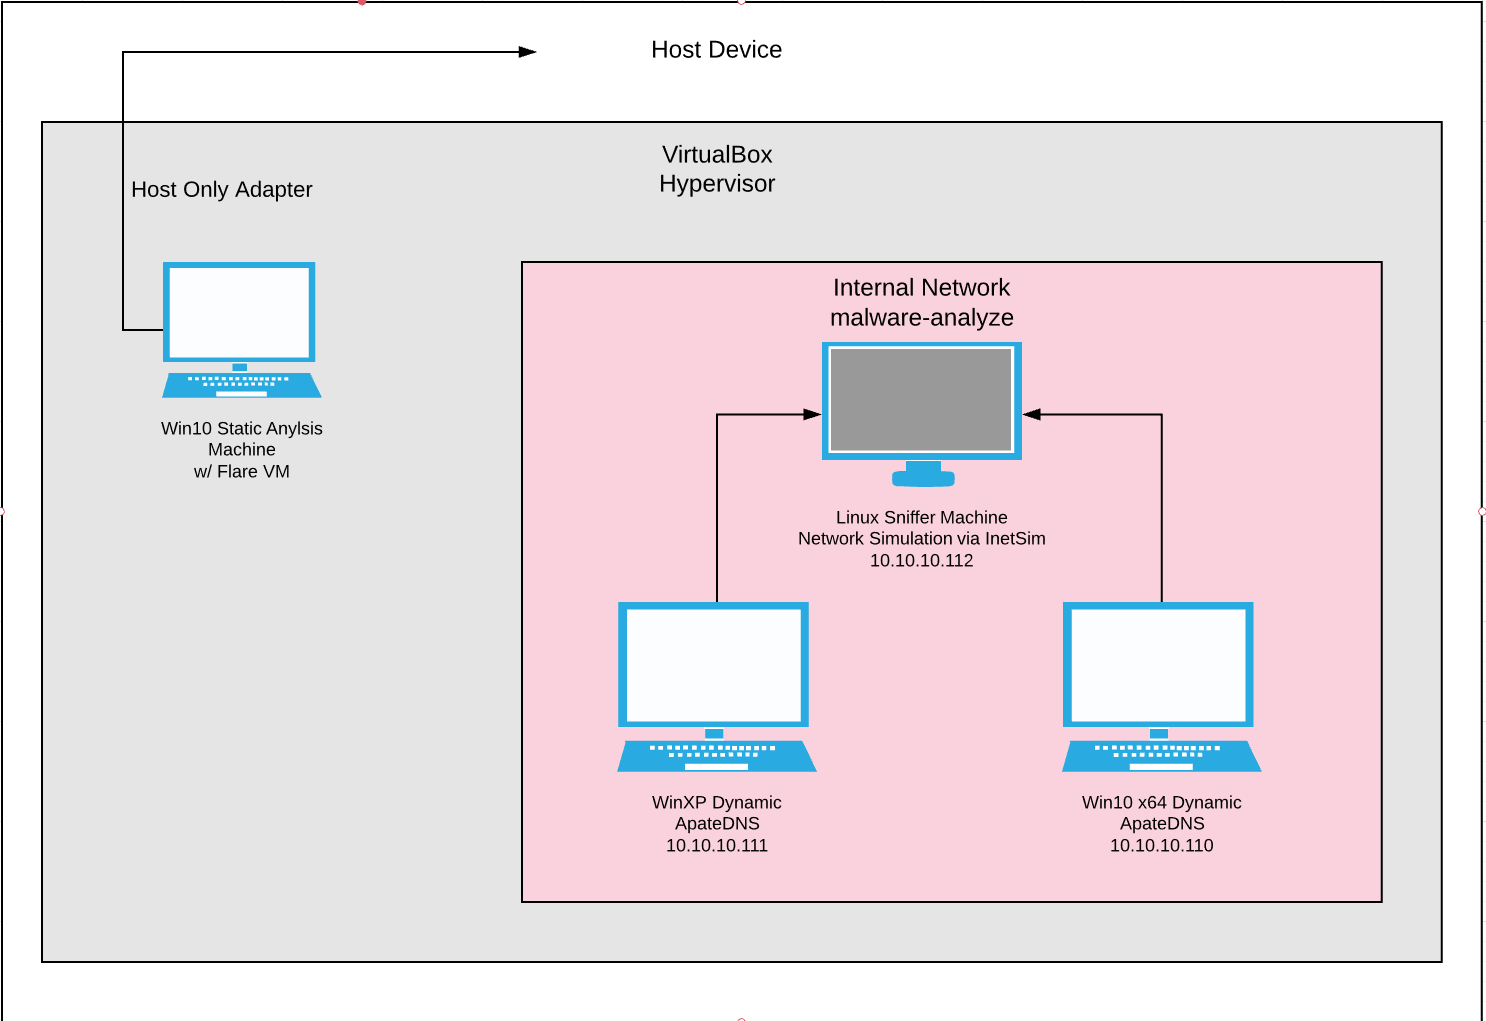
The live sample I am using was sourced from a repository known as the malware DB aka “The Zoo”. Disclaimer, everything on malwareDB is live and for research purposes only, so be careful with any files you grab from there. It’s good practice to use an environment that is dedicated for malware analysis and separated from your host system. This ensures that when handling malware you don’t accidentally infect any critical/sensitive systems. Here is a quick overview of my current lab environment:
Lab Environment:
- Windows 10 Static Analysis VM running FLARE (nothing executed here)
- Windows XP “Infected” machine
- Ubuntu “Sniffer” machine spoofing web services via Inetsim
All the VM’s above will be run on the virtual box hypervisor isolated from my host machine and network. The dynamic analysis machines are set up on their own internal network and won’t have the virtual box guest additions installed. These precautions are taken due to the fact that we are executing live malware on these machines and don’t want to risk anything escaping the environment (albeit these sort of capabilities are rare). We will be using guest additions on the static analysis machine, however the malware will not be executed in this VM whatsoever. Once the labs are all set up, the only thing to do is to grab the password protected zip file containing the Proteus malware from malwareDB. The password to unzip the file is “infected”. Once we do this and copy the files into our environments and take our initial snapshots we are ready to dive into the analysis!
Static Analysis:
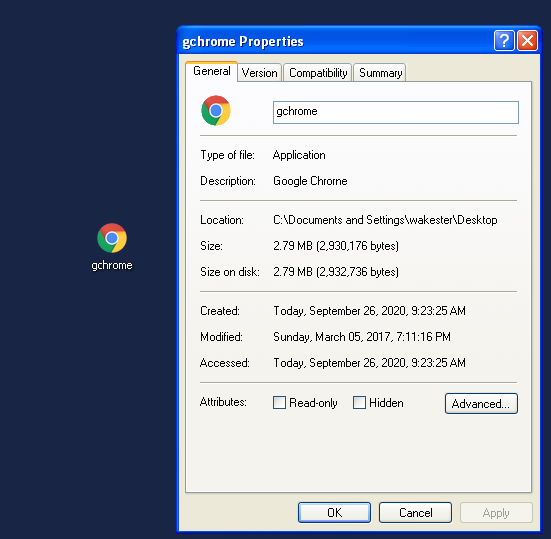
After getting everything transferred onto my static analysis VM, the first thing I did was unzip the files. A single file was dropped onto the system called gchrome.exe. The files icon was a copy of google chrome, trying to trick users into believing it was the actual google chrome application.
I immediately dropped the file into 010 hex editor to verify the PE executable format by looking at the first bytes of the header for “MZ”. I was also able to use PEiD to confirm that the application itself was not using any packers and used md5sum to grad a file hash of the executable. Next, using PEView, I was able to find that the compile time of the application was back in 2016 and that this application also included GUI components.
After all of that basic verification, I then decided to fire up PEStudio to see if I could extract more information from the file. PEStudio is one of my favorite tools for static analysis as it lets you check the imports, exports, PE Header sections, ect of a file. The first place I looked was the section view to check the raw size vs the virtual size of the file. If a file’s virtual size is bigger than its raw size it can indicate some sort of compression or packer is in use. In this case however, both the virtual and raw sizes were relatively the same, meaning nothing is compressed. I then switched over to the imports / exports pane. Looking at the functions an application imports / exports can give you a quick fly by view of what the program might do on execution (ex: writes to files, perform networking functions, ect). Unfortunately, little information was given here. No exports were present and the executable only seems to import functions from mscore.dll. However, looking at the MSDN mscore.dll is associated with .NET, indicating that this application was most likely developed using the .NET framework.
The next logical place to look after the imports section is to switch over to the strings view in PEStudio to see if we can extract anything interesting. Parsing through all the garbage I was able to find some hard coded IP addresses, CryptoGraphic functions and what looks like possible commands for a C2. Here are the actual strings that were found:
- 10.0.0[.]0
- 4.0.0[.]0
- 9.89.11[.]5
- 55.0.2840[.]99
- CreateDecryptor / System.Security.Cryptography
- Create, Write, Copy, Control, Invoke
Outside of tossing the executable into a decompiler, we have exhausted what can be done with basic static analysis. Unfortunately debugging a program is a time consuming process, so I am going to save that for another post. We were however able to extract some valuable information about the program. Here is a quick summary of our findings thus far:
- gchrome.exe File Hash : 49FD4020BF4D7BD23956EA892E6860E9
- A single PE executable disguised as google chrome is dropped onto the machine
- This executable is not packed
- Compile time was on 11/21/2016
- The program was most likely developed using .NET framework
- Some interesting IP addresses / functions were extracted via plain text strings
Dynamic Analysis:
The next logical step in analyzing this malware is to perform some basic dynamic analysis. This is going to involve executing the malware on a virtual machine to capture network traffic, registry changes, file changes, ect. We are going to use a single Windows XP machine connected to a Ubuntu machine spoofing common protocols to perform our analysis. The first thing that needs to be done before we can perform any sort of dynamic analysis to ensure our environment is set up correctly. Here are the following steps I performed before executing the sample:
- Copy over our executable to the Windows XP VM
- Turn off share clipboard and drag/drop
- Ensure both the sniffer and XP machine are on an isolated network and test connectivity
- Ensure virtualbox guest additions is uninstalled on the XP machine
- Take snapshots of both the sniffer and XP machines
- Start inetsim and wireshark on the sniffer machine
- Take a snapshot of the registry with RegShot on the XP VM
- Start procmon, ApateDNS and process explorer on the XP VM
For reference here is a quick summary of the tools being used for analysis:
- Inetsim = simulates common protocols such as FTP, HTTP, NTP, ect
- Wireshark = used to capture network traffic from the infected VM
- RegShot = take snapshots of the registry and compares them for changes
- Procmon = allows you to analyze what a process does (file wirtes, reg changes, ect)
- ProcessExplorer = gives you a view of all processes running (like a more indepth version of task manager)
- Autoruns = used to see if a malicious file set executables to run on startup
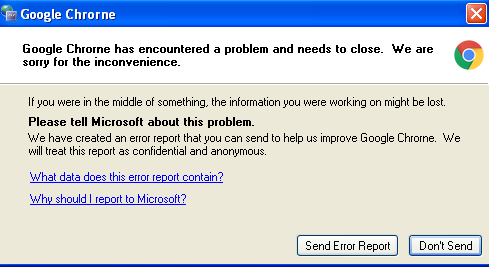
After double clicking the application and launching it, immediately the original .exe disappears and you are met with a screen stating “There was an error with chrome” and giving you the options to either “send a report” or “don’t send”. No matter which option you choose the application respawns with the GUI component which always overlays any other applications you have open.
During the initial launch I was watching process explorer to see what processes the executable would spawn. On execution, gchrome is replaced with a chrome.exe process which in turn spawns a child process DW20.EXE, which is run with the command line arguments -x -s 508. If you click any of the prompts in the GUI component, a new instance of chrome.exe is spawned.
Pivoting frome here I decided to take a look in ProcMon to see what different actions Proteus takes on the machine. I set the filters to include only file writes, registry writes and network calls for the gchrome, chrome and DW20 processes. While this application performed a ton of actions on the host, some items were interesting to note. The first item I noticed was that a document “new text document.txt” was dropped into \Application Data\. The contents of this file was a single string containing the hash of the program. I am guessing this might have to do with a check to see if another instance of the application has already run, but I am not really sure. The next interesting item I found was that DW20.EXE was created in the folder C:Program Files\Common Files\Microsoft Shared\DW\. Also existing here were a number of DLLs. Quickly looking at the executable, it seems this is the main executable that is dropped onto the machine which performs the core functions for the malware as there are a large number of imports present. Lastly there is a chrome.exe application dropped into C:\Users\admin\AppData\Roaming.
Moving over to registry items, a lot of registry writes were performed by Proteus making it tough to sort out what was garbage and what was not. The most interesting item that I found was C:\Users\admin\AppData\Roaming\chrome.exe being written to key HKEY_CURRENT_USER\Software\Microsoft\Windows\CurrentVersion\Run. This is used as a persistence mechanism to ensure that the application runs on startup.
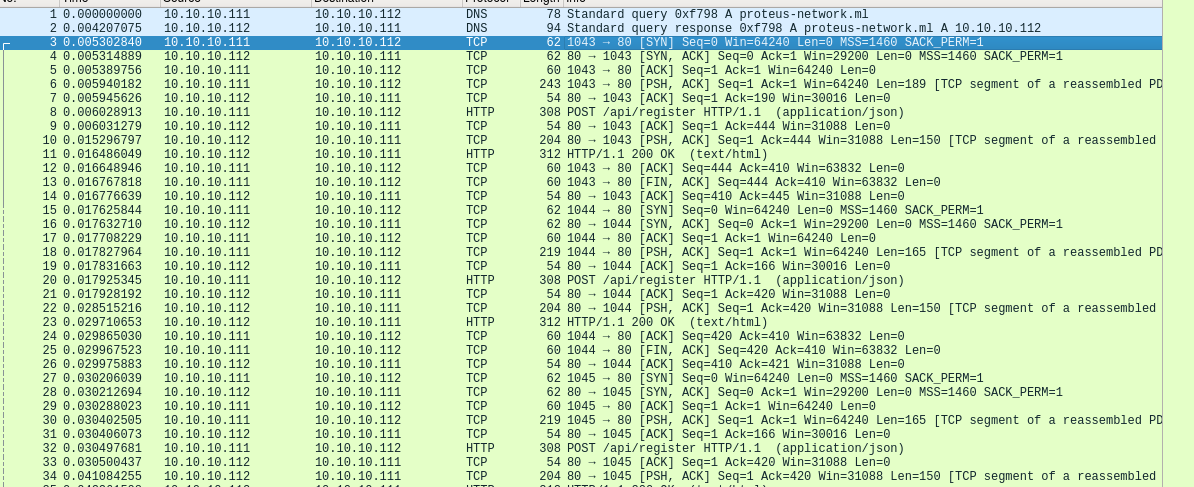
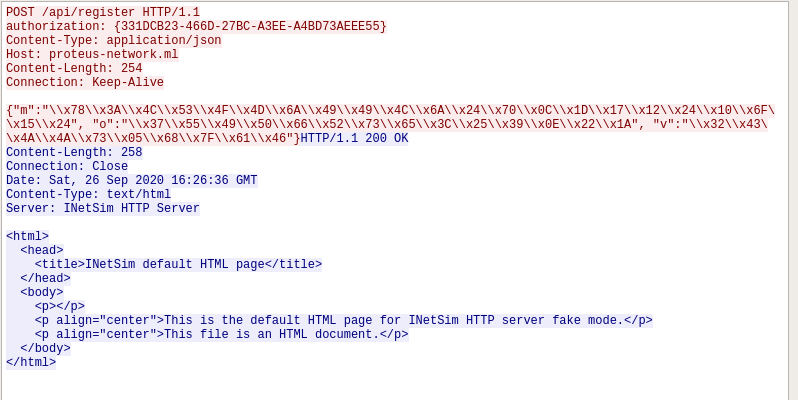
Switching gears, the next place I decided to look was on the sniffer VM to see what network traffic was captured in Wireshark. The first two items where DNS queries out to the domain proteus-network[.]ml. OSINT on this domain shows that it is no longer active. The rest of the items captures were repeated GET requests to the domain followed by POSTS requests to /api/register with the JSON contents of {“m”:”\x43\x68\x39\x39\x6C\x69\x5D\x3B\x63\x6C\x49\x1F\x22\x79\x77\x34\x36\x13\x62\x45\x35\x07”, “o”:”\x43\x40\x36\x7E\x73\x72\x41\x11\x29\x5A\x17\x1B\x02\x28”, “v”:”\x3C\x67\x36\x52\x61\x0B\x4C\x03\x79\x54”}.
While I am not exactly sure what these JSON contents represent, it seems that this has to do with the application registering the host with the C2 / botnet. As Inetsim fakes the domain and the original domain no longer exists, there is no way to figure out any additional communications that would have occurred outside of deconstructing the application using IDA. This is where I pretty much hit a dead end for dynamic analysis. While I could dive deeper into the actions the malware is performing, I feel like it’s not worth my time doing so as I was able to extract the majority of the IOCs I was looking for. Here is a summary of my findings:
Dynamic Analysis Findings:
- Network connection out to proteus-network[.]ml
- GET / POST requests out to the C2 that contained an interesting payload
- Files Dropped:
- C:\Documents and Settings\wakester\Application Data\chrome.exe
- new text document.txt (contents is hash of application)
- C:Program Files\Common Files\Microsoft Shared\DW\ directory containing DLLs. EXEs, ect
- HKEY_CURRENT_USER\Software\Microsoft\Windows\CurrentVersion\Run set with C:\Users\admin\AppData\Roaming\chrome.exe
- gchrome process is replaced by chrome process which further creates the DW20 process
- GUI pop occurs with interaction items, each interaction spawns a new “chrome” process
So while I didn’t figure out too much about the overall functionality of the application during this analysis, some interesting items were still able to be extracted from the sample. I could probably spend more time analyzing the files dropped and registry items changed, however I didn’t find it worth it as I reached my goal of extracting some basic IOCs. I plan on doing a deeper dive into this sample in my next post where I actually go in and try and figure out the overall functionality of the malware. I feel like this will be an awesome learning experience. For now though, I am content with my findings. I hope you enjoyed this post and learned as much as I did throughout the process! Until next time all!
IOC’s
- proteus-network[.]ml
- 49FD4020BF4D7BD23956EA892E6860E9
- DW20.EXE
- gchrome.exe
- C:\Users\admin\Documents\New text document.txt
- C:\Users\admin\AppData\Roaming\Tamir.SharpSsh.dll
- C:Program Files\Common Files\Microsoft Shared\DW\
- HKEY_CURRENT_USER\Software\Microsoft\Windows\CurrentVersion\Run, value=C:\Users\admin\AppData\Roaming\chrome.exe
